On typical data projects, clients would ask us to flag business quality issues on gold layer tables. Simple ask. The honest answer was almost always the same: give us a few days for a PR, a review, and a deploy. A one-line business rule with a real deadline attached, stuck behind a code release process built for actual code changes. That’s the problem this project came out of.
What it does
Three pieces. Only one of them should ever need an engineer.
- Config table (Delta). Every rule (table, column, check, parameters, criticality) is a row. Adding a rule is an insert, not a deploy.
- Validation pipeline. Reads active rules per rule group, runs them in parallel with a
ThreadPoolExecutor, and tags each run with a UUID batch ID. Six check types: completeness, validity, accuracy, timeliness, uniqueness, consistency. - Results log (Delta). Every run writes pass/fail, a metrics JSON, and duration back to a table. It’s SQL-queryable, so no separate reporting layer is needed.
Rules toggle on or off individually or by group, at runtime. That matters more than it sounds like it should, since most DQ maintenance is turning things off during known bad windows, not writing new checks.
What it taught me
Put business logic in data, not code. The generic checks, nulls on primary keys, basic types, are the ones you could hardcode once and rarely touch again. The real pressure comes from the long tail of business-nuanced rules: a tolerance band that shifts with the quarter, a valid-values list that changes when a process changes. Those aren’t bugs. They’re business decisions on a business timeline, and putting them in a config table means someone closer to the business can add or adjust one without an engineer or a deploy in the loop.
That only holds up if it survives a failure too. Otherwise “add your own rule” just means filing a ticket the moment it breaks. Every failed rule writes back a ready-to-run dq_affected_rows_sql query, the exact statement that reproduces the offending rows. The same person who set the threshold can paste it into a SQL editor and see what failed. No translation step, no engineer needed on that side either.
Not every failure deserves the same reaction. Every rule carries a criticality tag, high, medium, or low, and that tag decides what happens next, not the pass/fail result itself. Treating every failure as equally urgent trains people to stop paying attention to any of it. Criticality is a triage tool, not a substitute for someone periodically checking that the tiers still make sense.
Where it stands next to dbt and Great Expectations
The vocabulary overlaps almost entirely. dbt ships four built-in generic tests (not_null, unique, accepted_values, relationships), and the dbt-expectations package adds 50-plus more covering ranges, patterns, and freshness. Great Expectations covers the same ground through Expectations and Checkpoints, with auto-generated documentation on top. The six check types here are just a different taxonomy over the same primitives.
The real difference is where a rule lives. In dbt and GX, a rule is code: reviewed, version-controlled, deployed with everything else, even when it’s a one-line threshold. Here, a rule is a row. That’s a governance difference, not a syntax one. It changes who can make the change and how fast, not just how it’s written.
Where dbt and GX still win, honestly: a much bigger library of prebuilt checks, and in GX’s case, auto-generated stakeholder documentation. DAG-aware gating matters upstream, where a failed test can stop a bad transformation before the next layer. This framework sits on gold tables, past the transformation DAG. There’s no next model to block, only downstream consumers to warn. The real limit is portability. Databricks-native fits where gold tables already live, but it’s a genuine constraint elsewhere.
That documentation gap is the one this dashboard answers directly.
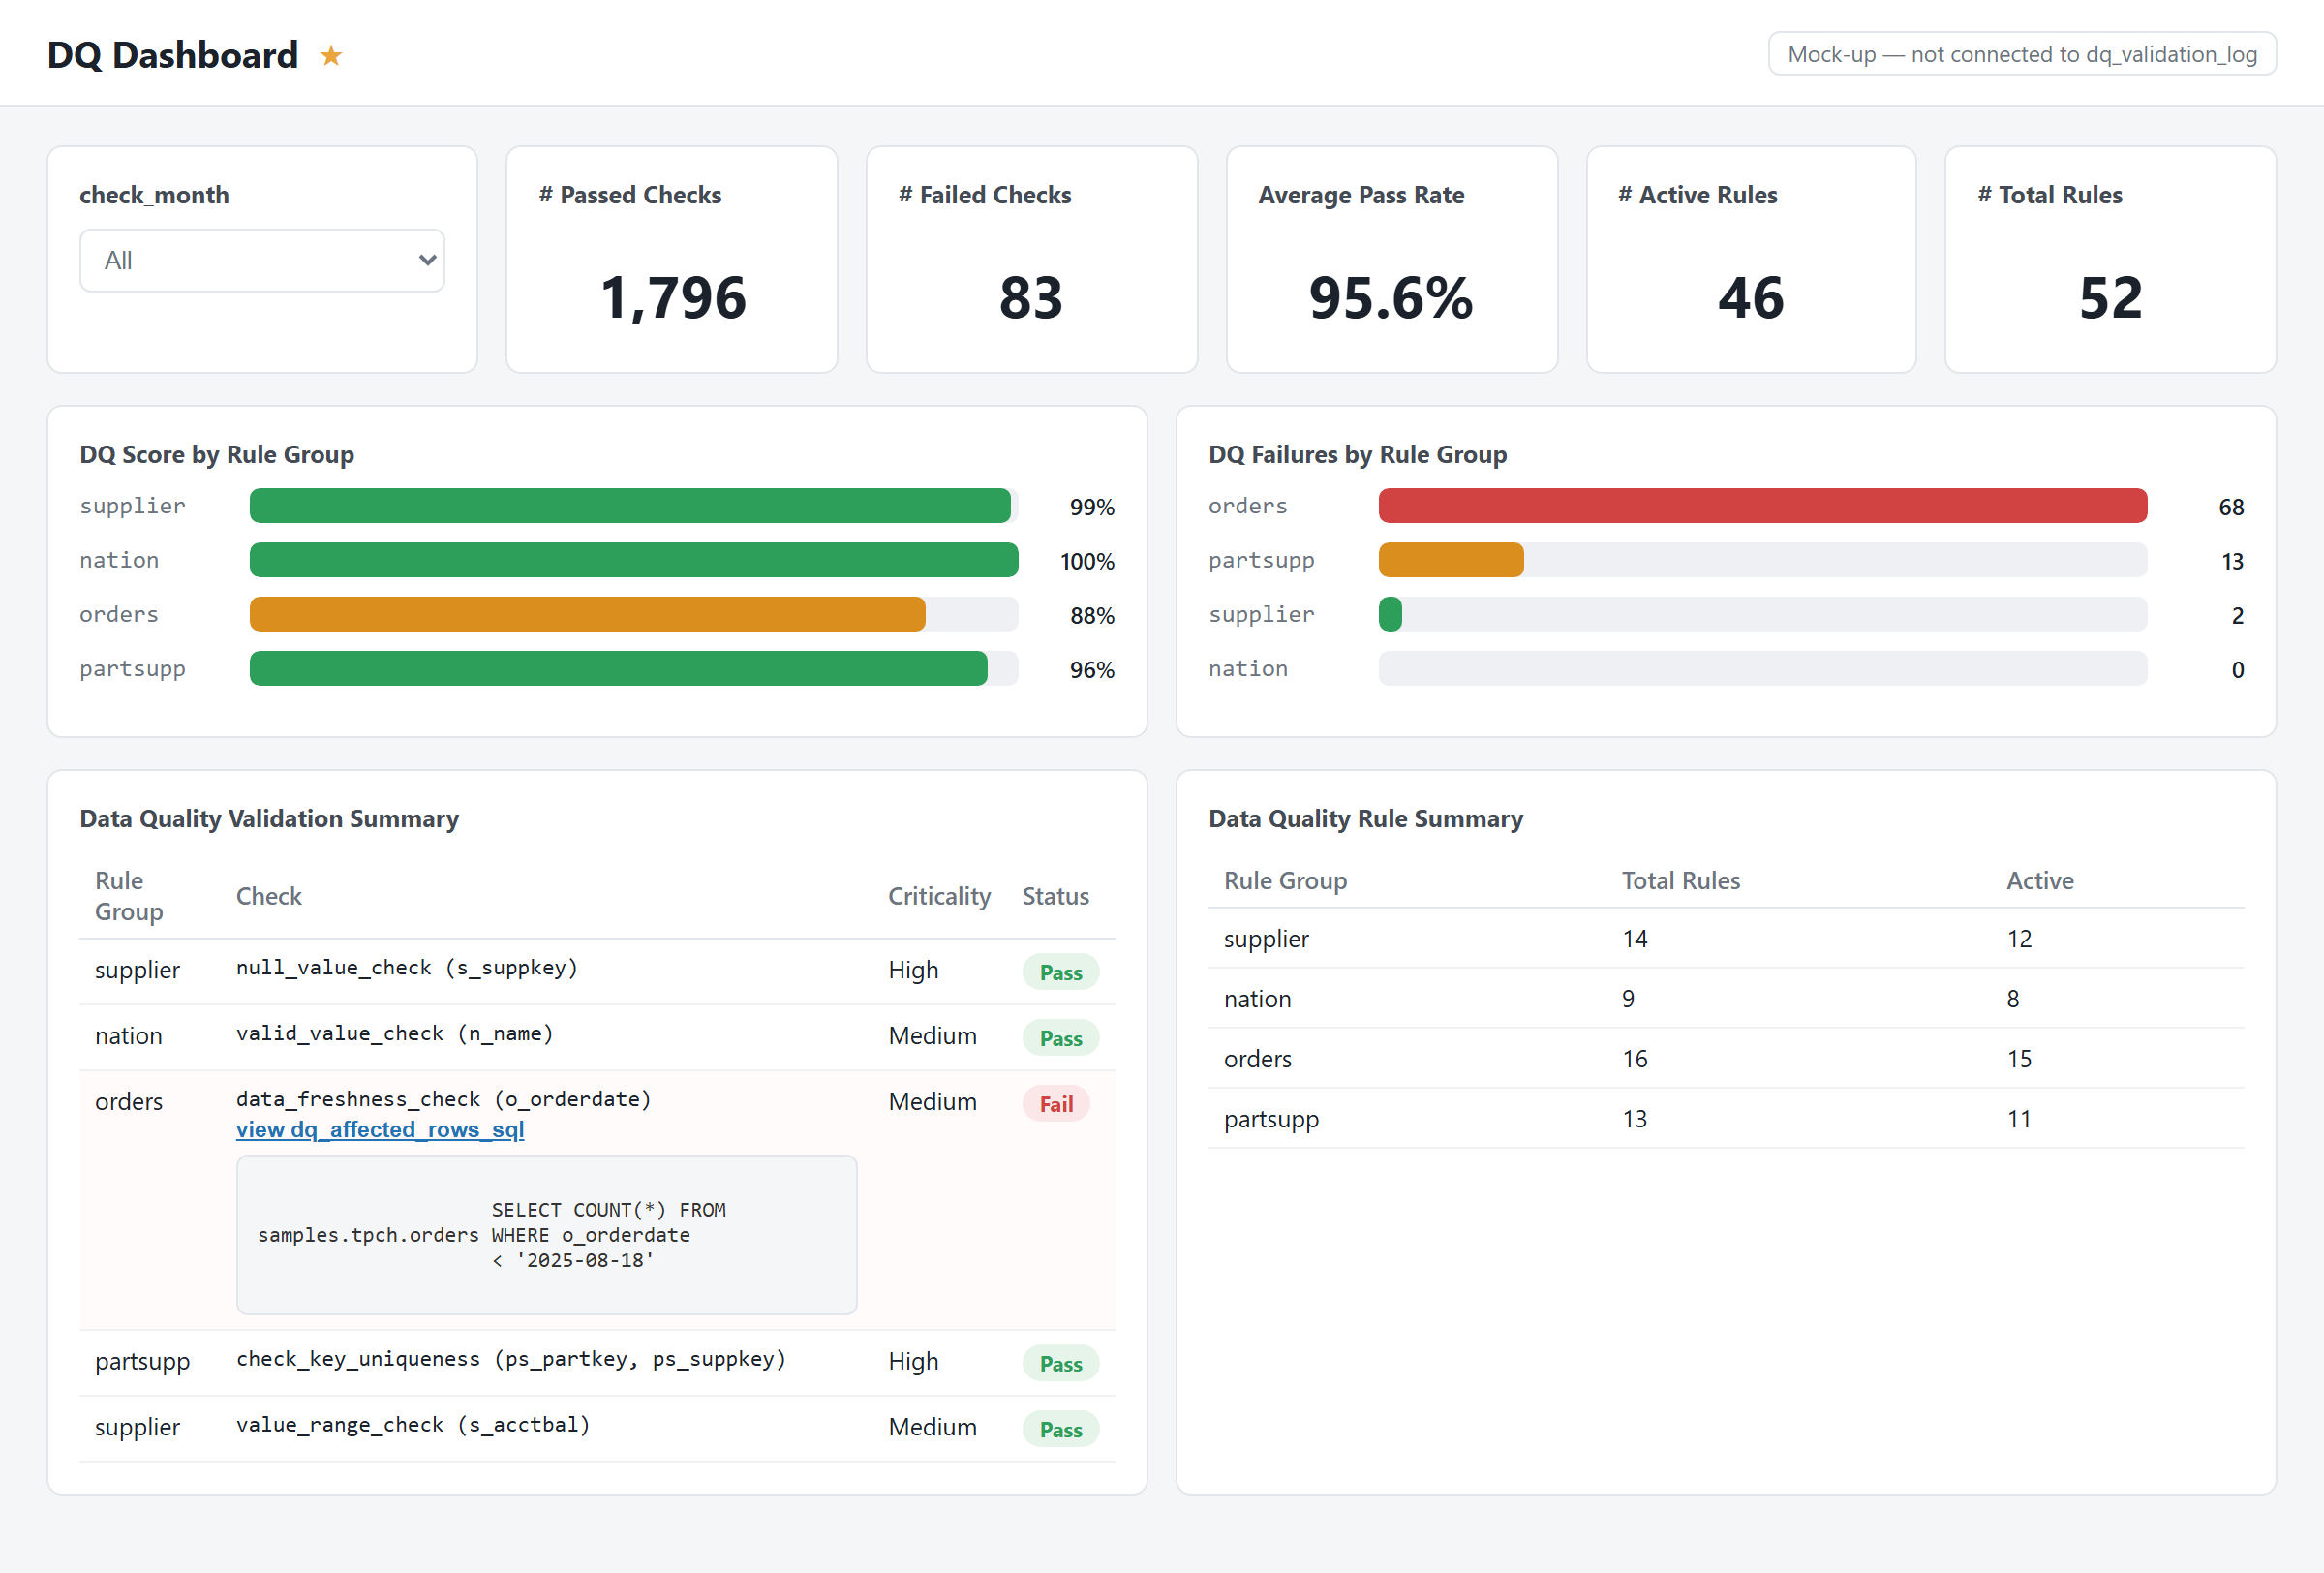
Pass rate, active vs. total rules, and a score broken out by rule group (the same rule groups that exist for triage in the first place) are now visible to someone who isn’t reading SQL. Most groups sit clean in the high 90s. One visible dip surfaces on its own without digging. Click into the failed row and the dq_affected_rows_sql query is right there, expandable, ready to paste into a SQL editor. The dashboard doesn’t just report the failure. It hands over the same investigation step a business owner would already have from the config side.
Where this lands
A validation layer that behaves like configuration, not application code. Cheap to change, triaged so failures compete for attention instead of drowning each other out, and now visible without a SQL editor. It doesn’t replace dbt tests or Great Expectations so much as answer a narrower question: what happens when the person who needs a new rule isn’t the person with repo access. The moment a data quality rule needs a code review before it can run, most teams quietly stop writing new rules. That’s the failure mode this is built to avoid.
Have you drawn this same line between “config” and “code” somewhere in your own data platform? I’d like to hear where it held up and where it didn’t. Comment on LinkedIn.